Biplot method for evaluation of saponins in soybean cultivars.
Biplot method for evaluation of saponins in soybean cultivars.
Author(s): OLIVEIRA, M. C. N. de; CARRÃO-PANIZZI, M. C.; MANDARINO, J. M. G.
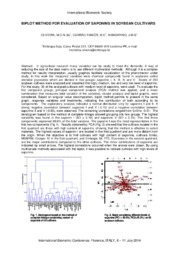
Summary: In agricultural research many variables can be study to meet the demands. A way of reducing the size of the data matrix is to use different multivariate methods. Although it is a complex method for results interpretation, usually graphics facilitate visualization of the phenomenon under study. In this work the measured variables were chemical compounds found in soybeans called steroidal glycosides which are divided in five groups: saponins I, II, III, IV and V. Seeds of 233 soybean cultivars were analyzed and classified into high, medium, low and very low level of saponins. For this study, 50 of the analysed cultivars with medium level of saponins, were used. To evaluate the five compound groups, principal component analysis (PCA) method was applied, and a linear combination that measures total variation of the variables, cluster analysis and biplot graphic, were considered. Based on singular value decomposition, biplot method permits to present in the same graph, response variables and treatments, indicating the contribution of both according to its components. The exploratory analysis indicated a normal distribution only for saponins I and II. A strong negative correlation between saponins I and V (-0.70) and a negative correlation between saponins II and V (-0.60), were observed. The remaining correlations ranged from 0.40 to -0.51. The dendogram based on the method of complete linkage allowed grouping into few groups. The highest variability was found in the saponin I (SD = 0.19) and saponins V (SD = 0.15). The first three components explained 89.6% of the total variance. The saponin I was the most representative in the first two components (Fig 1). Results obtained by PCA (Fig. 2) showed that the cultivars located in the first quadrant are those with high content of saponins, showing that this method is effective to select materials. The highest values of saponin I are located in the first quadrant and are more distant from the origin. When the objective is to find cultivars with high content of saponins, cultivars União, MGBR56, Ocepar 10 in the first quadrant, and Embrapa 58, FT2, Dourados in the second quadrant, are the major contributions compared to the other cultivars. The minor contributions of saponins are indicated by small arrows. The highest correlations occurred when the arrows were closer. By using multivariate methods associated with the biplot, it was possible to indicate cultivars with high levels of saponins.
Publication year: 2014
Types of publication: Abstract in annals or event proceedings
Unit: Embrapa Soybean
Keywords: Bioestatística
Observation
Some of Embrapa's publications are published as ePub files. To read them, use or download one of the following free software options to your computer or mobile device. Android: Google Play Books; IOS: iBooks; Windows and Linux: Calibre.
Access other publications
Access the Agricultural Research Database (BDPA) to consult Embrapa's full library collection and records.
Visit Embrapa Bookstore to purchase books and other publications sold by Embrapa.